Four ways in: the office, the deck, the bench, and your own files.
The cloud
Most people only ever see the cloud site. It receives every Iridium message, decodes it against the format registry, and keeps the raw bytes beside the decoded result. Members of a deployment see their buoys on a map, each capture’s spectrum and direction, battery and temperature over time, and can download a date range as CSV, JSON or a ZIP archive.
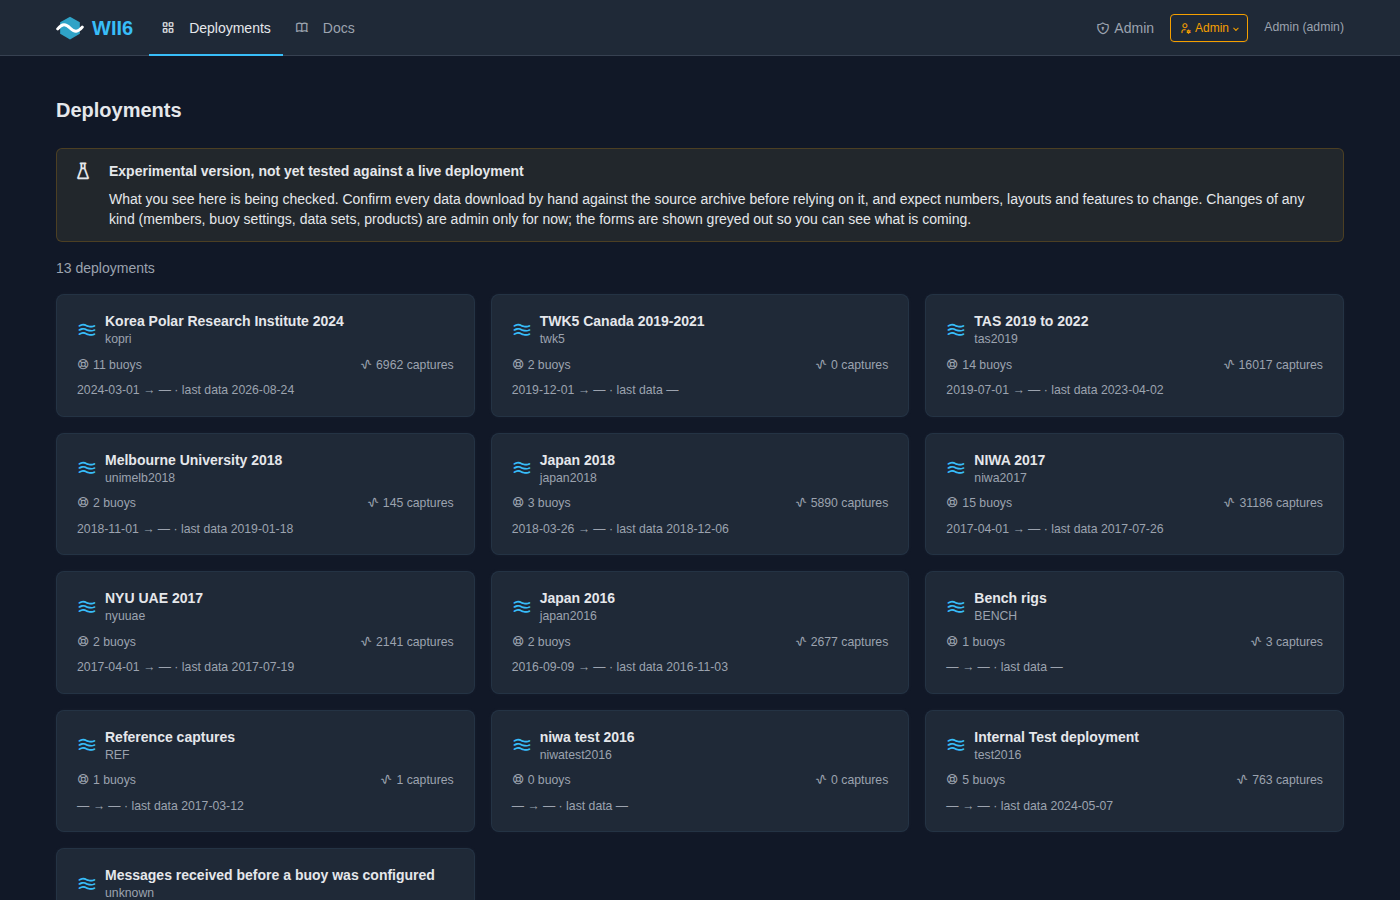
Deployments: projects and their buoys, with capture counts and the time of the most recent message received. Archive counts can include test units; the KOPRI count includes ten deployed buoys and one test buoy.
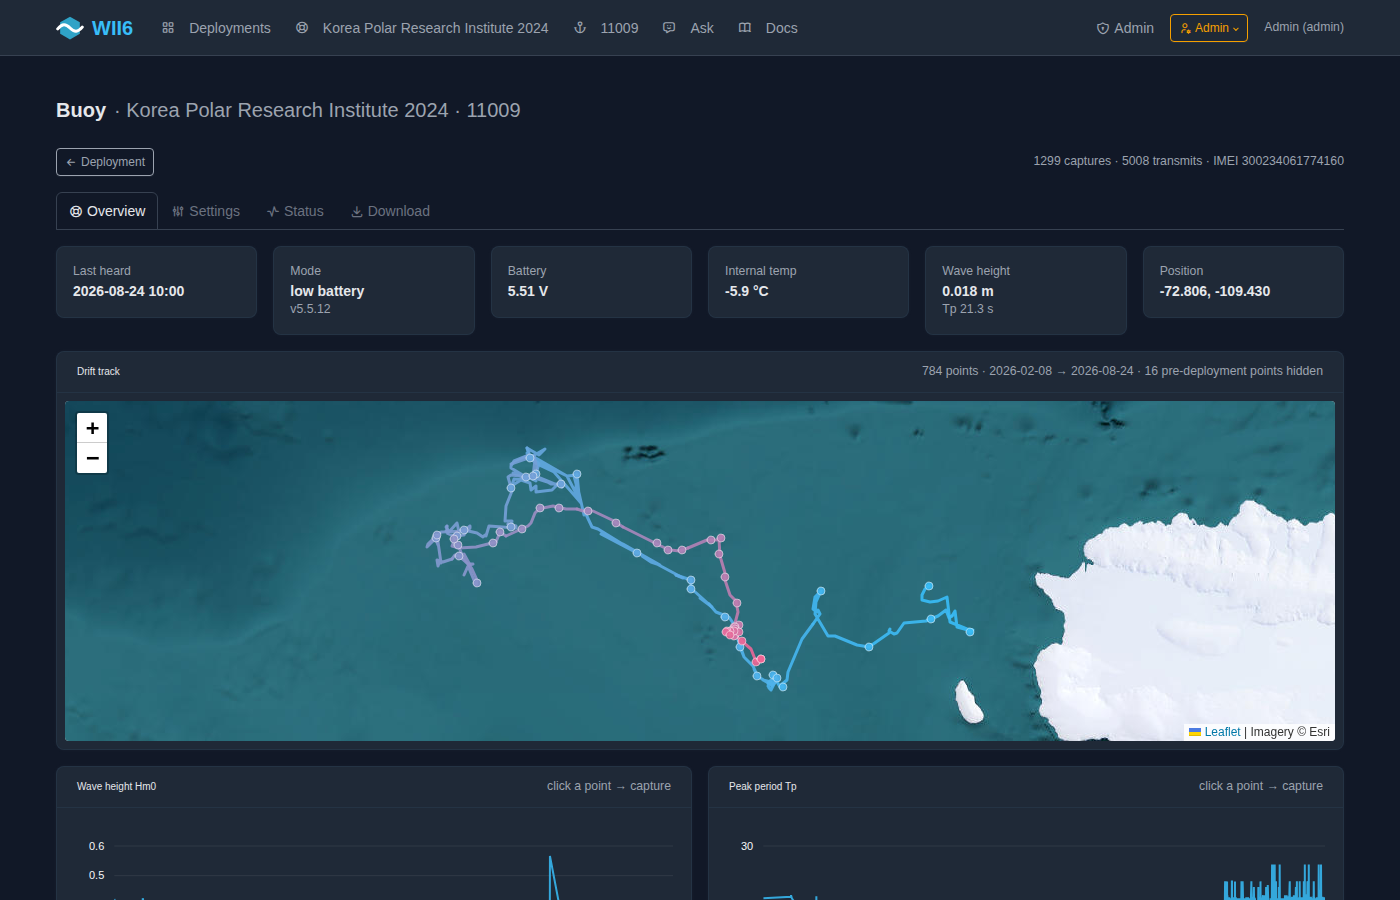
One buoy: state at a glance, and the drift track on satellite imagery.
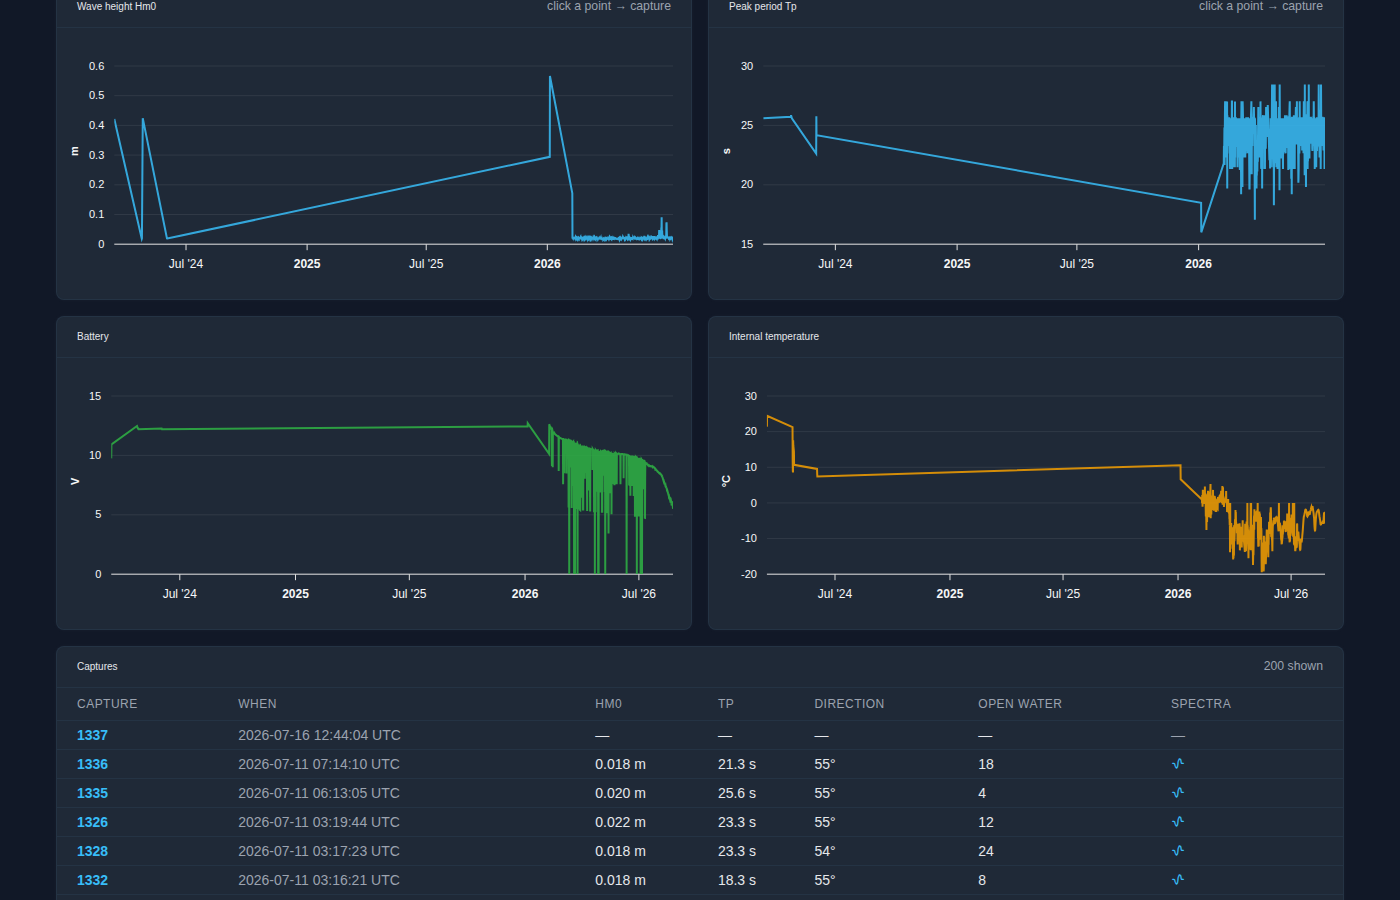
Wave height, period, battery and temperature over the whole deployment, and the capture list below, one row per measurement.
Settings changes are recorded, and marked applied once the buoy echoes them back.
The cloud site runs at console.wii6.au, on the same OGLAS platform as Digital Dimensions’ other remote monitoring products, and it imports the whole history: every message since 2016 is there in its original form. Access is per deployment; ask us for an account.
The dashboard on the buoy
The pages below are the buoy’s own web dashboard, used for development, bench testing and checking a buoy on deck before deployment. The dashboard is being developed alongside the firmware; these screenshots use simulated sensor data.
The buoy carries an ESP32-S3 whose only job is to talk to people. Power it on and it puts up a WiFi network and a single page: GNSS, motion sensor, Iridium, temperature, card, power, and the state of the link, refreshed once a second. It works on a phone on the deck and on a laptop on the bench, and it works when the WiFi is marginal, because it polls when the live socket cannot connect.
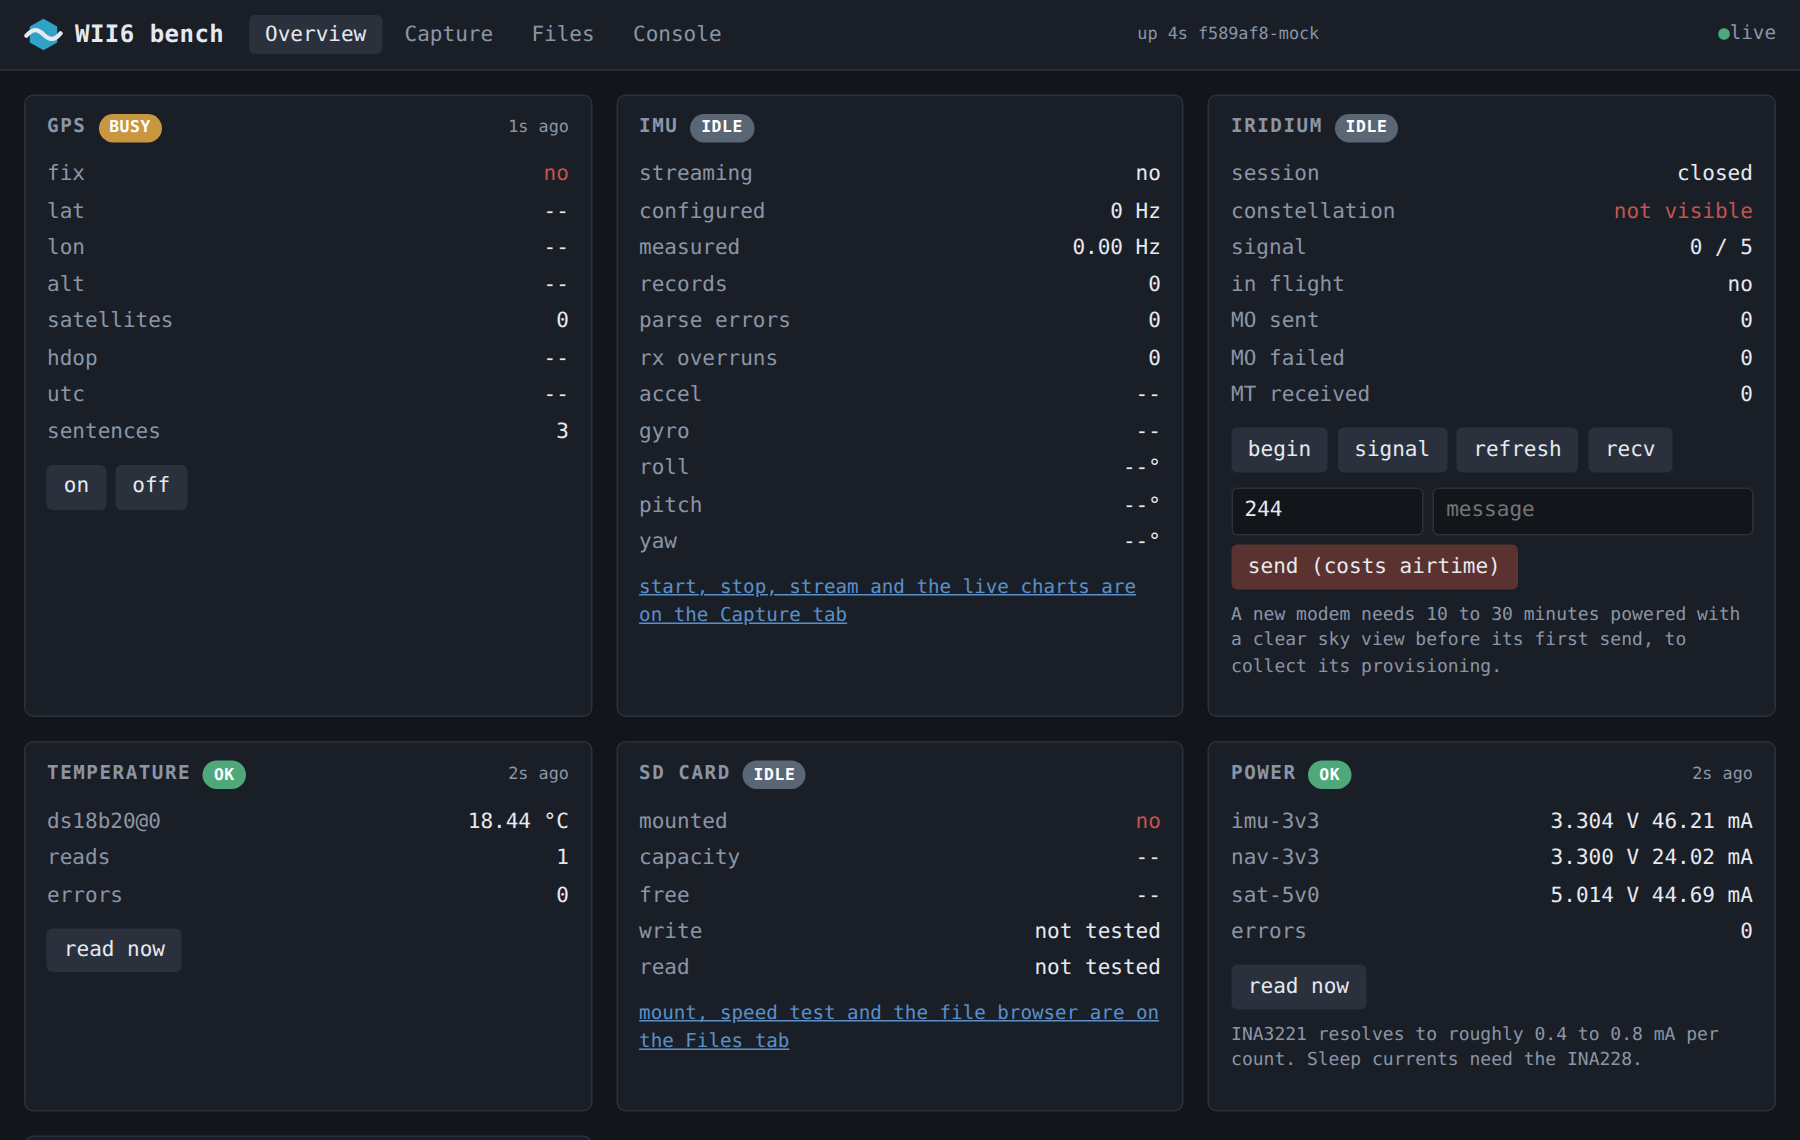
The overview: every subsystem as a tile, with its state and how old the reading is.
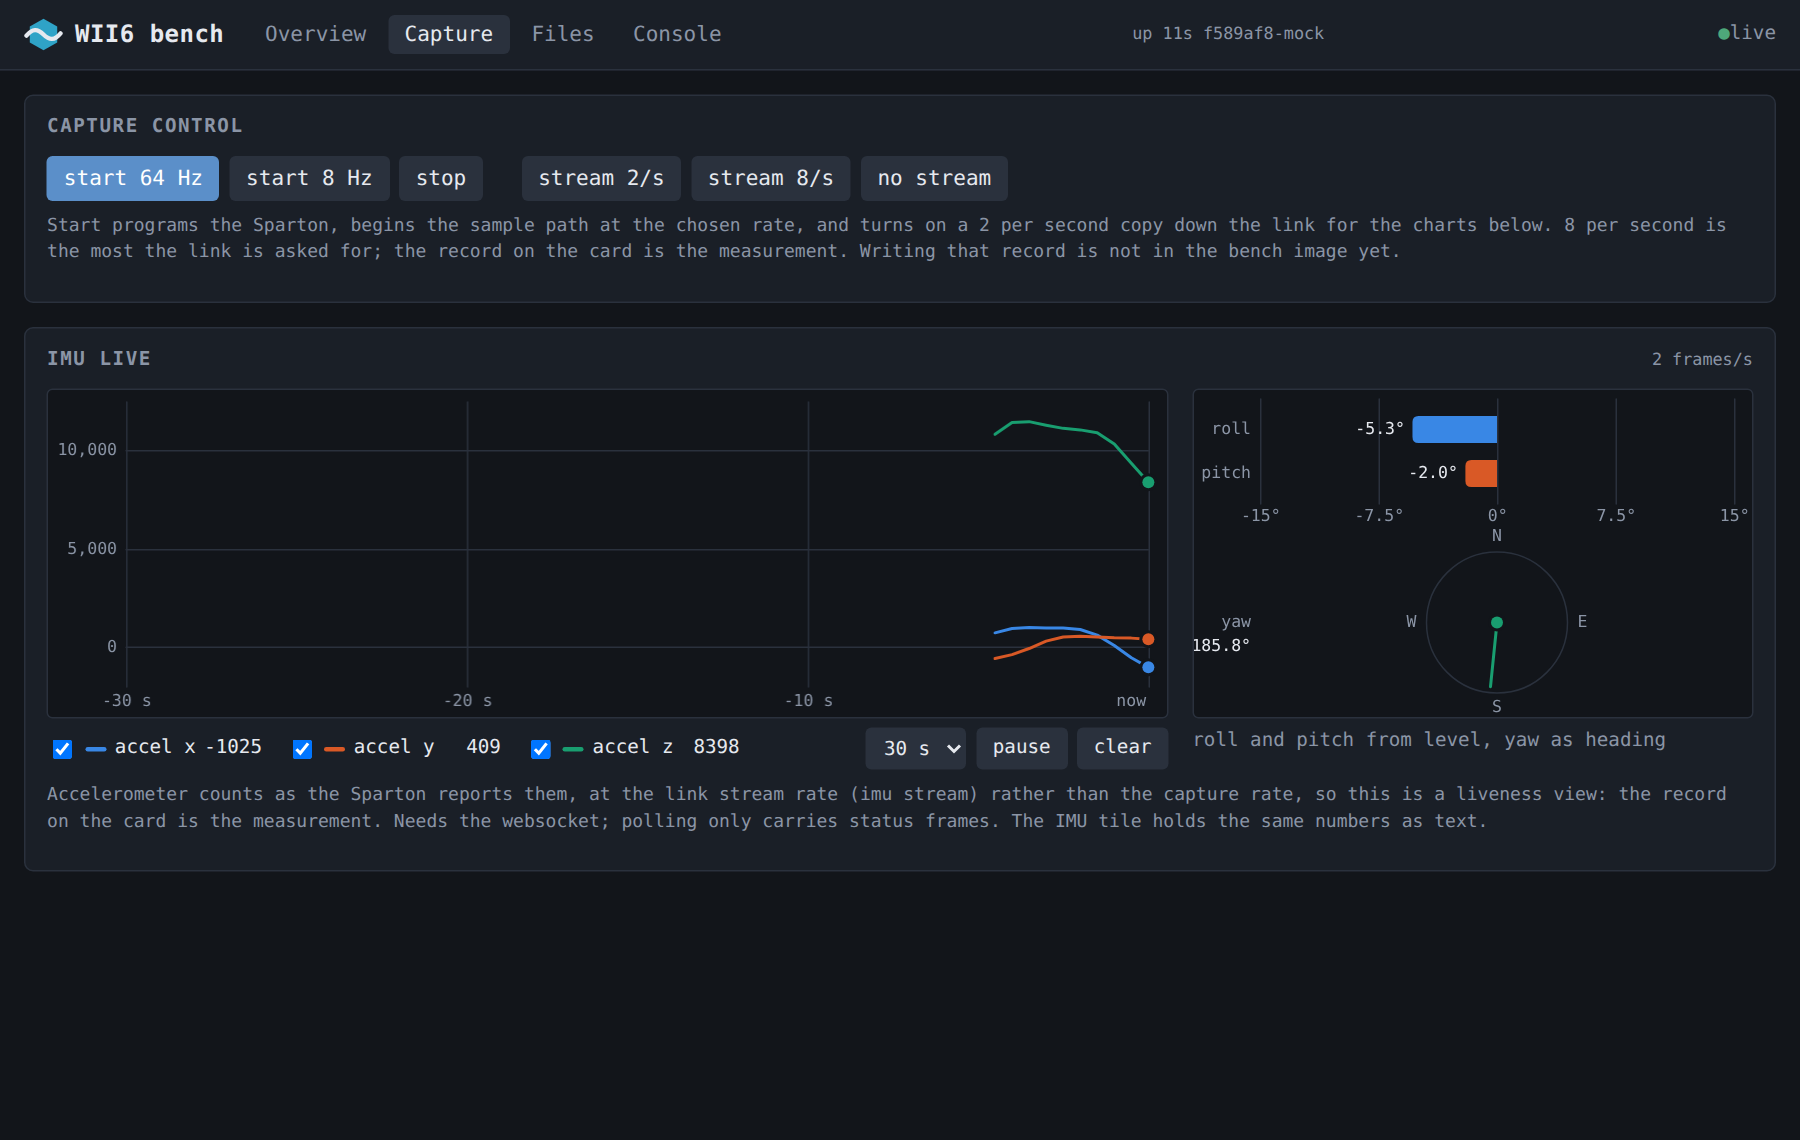
Capture: start the motion sensor and watch acceleration over time, roll and pitch, and heading, live.
The Capture tab starts and stops the motion sensor and streams it live, which is how a buoy is checked on the ice before the team walks away: pick it up, tilt it, and watch the trace. The Files tab browses the card. The Console tab provides access to the main processor’s shell, so anything the firmware can do is one command away, with the buoy’s own log streaming beside it.
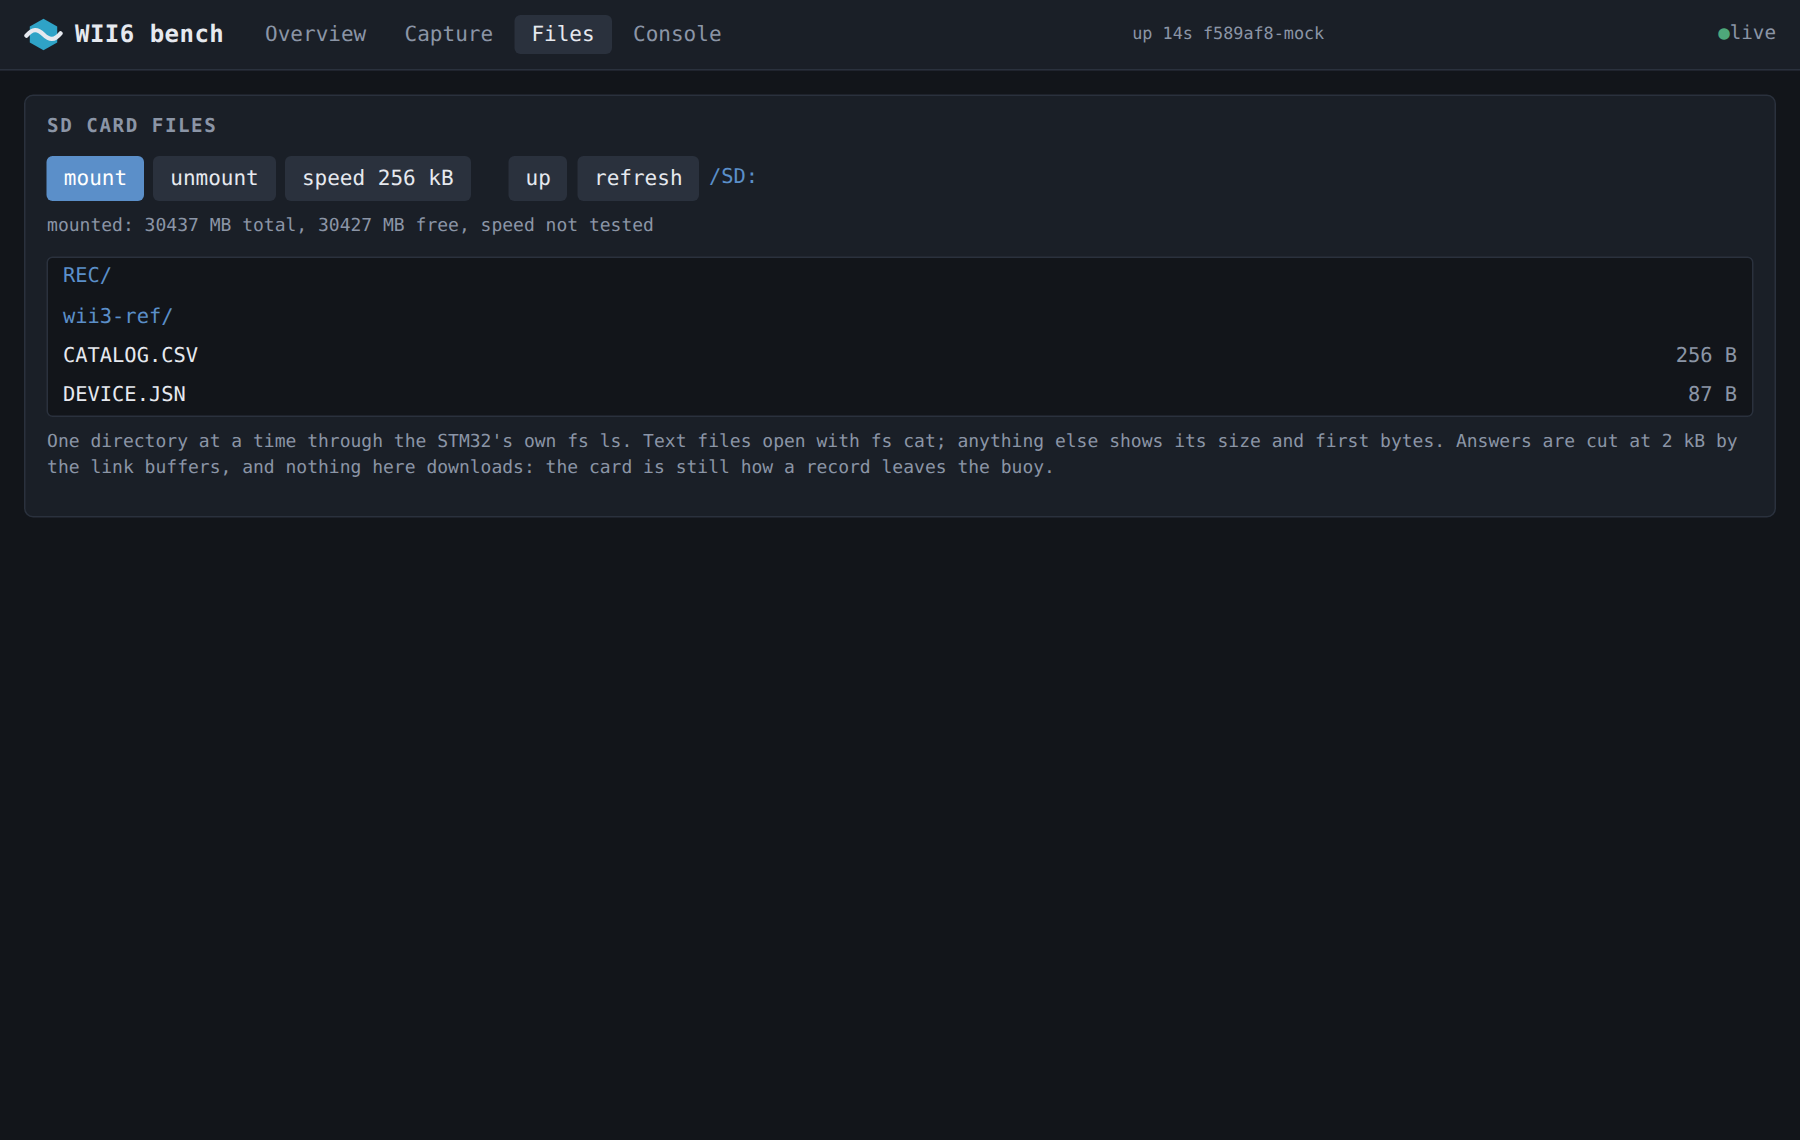
Files: the card as the buoy wrote it, one directory per record.
The whole dashboard is one page compiled into the debug processor’s flash. It needs no installation or internet connection. The debug processor is powered down during deployment.
The console
Under the dashboard is a text protocol between the two processors that a
person can drive from a serial terminal as well: status, imu start 64,
sat signal, sd ls, or any Zephyr shell command. Adding a subsystem to
the firmware makes it reachable from the browser the same day, because the
dashboard forwards commands without needing to understand them.
Your own tools
If you would rather work from files, everything the cloud shows is also in the data store: plain directories you copy with rsync, formats documented and versioned, and the same decoders the cloud uses available as a command-line tool. See formats and tools for how to obtain the documentation and decoders.